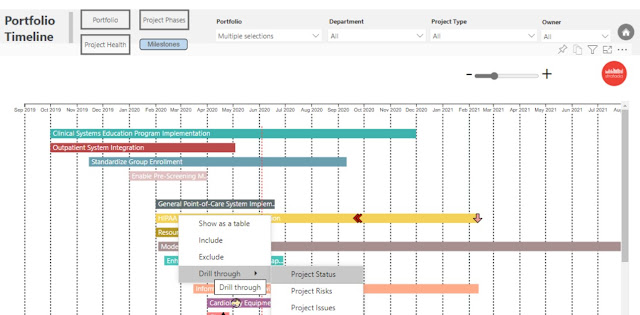
Powerful Power BI Tips that BI Company Uses For Creating Meaningful Dashboards

Microsoft Project Dashboard Reporting Company uses BI tools for developing dashboards that not just add visualizations to data, but also helps in retrieving answers and analyzing critical information. Using Microsoft's Power BI , you can extract data from a wide range of systems both in the cloud and on-premises to create responsive dashboards. These can be used to track the metrics such as KPIs and drill in to get answers to your questions about your data. You can create rich reports and dashboards which can be seamlessly embedded in you reporting portals or your PowerPoint Presentations. And the users can access them from any location and any device without missing out on any advanced features. Unlike the traditional form of reporting, these dashboards and reports go far beyond simple tables, pie, and bar charts. However, as a user, you do not need to have the technical know-how and can enjoy vibrant and customized reports. End-user benefits of Power BI Visualize your informatio...