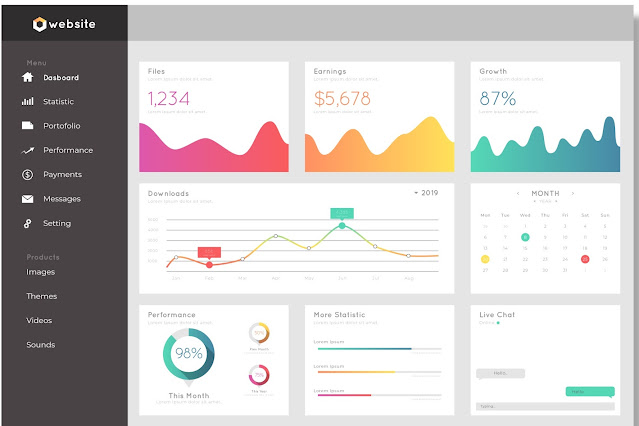
Jira Power Bi Dashboard | Stratada | Microsoft Data Strategy
Jira Power Bi Dashboard
 |
Jira is a popular project management tool used by many organizations to track tasks, issues, and projects. One of the key benefits of using Jira is the ability to gather data and insights into your team's performance and productivity. However, with so much data to sift through, it can be challenging to analyze and make sense of it all.
This is where Power BI comes in. Power BI is a business analytics service by Microsoft that provides interactive visualizations and business intelligence capabilities with an interface simple enough for end-users to create their reports and dashboards. With Power BI, you can create a comprehensive dashboard that displays key metrics and insights from Jira in real-time. In this blog, we will explore how to create a Jira Power BI dashboard.
Getting started with Jira Power BI Dashboard
To create a Jira Power BI dashboard, you will need to connect your Jira instance to Power BI. You can do this by using the Jira content pack for Power BI. The content pack provides a set of pre-built reports and dashboards that you can use as a starting point to create your customized dashboard.
To connect your Jira instance to Power BI, follow these steps:
- Open Power BI Desktop, click on "Get Data," and then select "Jira" from the list of available connectors.
- Enter your Jira URL and click on "OK." You will be prompted to enter your Jira credentials.
- Once you have entered your credentials, Power BI will connect to your Jira instance and import your data.
Creating a Jira Power BI Dashboard
After connecting your Jira instance to Power BI, you can start creating your dashboard. Here are some steps to follow:
- Start by creating a new dashboard in Power BI. Click on "New Dashboard," give it a name, and select the layout you want to use.
- Next, add visualizations to your dashboard. You can add visualizations such as charts, graphs, and tables. To add a visualization, click on the "Visualizations" pane and select the type of visualization you want to add.
- Once you have added a visualization, you can customize it by changing the data fields, colors, and formatting.
- To add data to your visualization, click on the "Fields" pane and select the data you want to use.
- Repeat these steps to add more visualizations to your dashboard.
- Save your dashboard, and it will automatically update with new data from Jira.
Key metrics to include in your Jira Power BI Dashboard
When creating a Jira Power BI dashboard, it's essential to include key metrics that provide insights into your team's performance and productivity. Here are some key metrics you might want to include:
- Issue status: Display the number of issues in each status (e.g., Open, In Progress, Resolved, Closed) to track the progress of your team's work.
- Time to resolution: Display the average time it takes for issues to be resolved to identify bottlenecks in your team's workflow.
- Issue priority: Display the number of issues in each priority level to ensure high-priority issues are being addressed promptly.
- Sprint progress: Display the progress of your team's current sprint to ensure they are on track to meet their goals.
Conclusion
In conclusion, a Jira Power BI dashboard can provide valuable insights into your team's performance and productivity. By connecting your Jira instance to Power BI, you can create a customized dashboard that displays key metrics and insights in real-time. With the right metrics and visualizations, you can make data-driven decisions that improve your team's workflow and productivity.


Comments
Post a Comment