Posts

Unleashing Data Insights with Power BI: A Project Report

Image
 Power Bi Project Report In the fast-paced and data-driven business landscape of today, organizations need tools that can effectively analyze and visualize their data to derive valuable insights. One such powerful tool is Microsoft Power BI. Power BI empowers businesses to transform raw data into meaningful reports and dashboards, enabling data-driven decision-making. In this blog post, we will explore the concept of a Power BI project report and how it can revolutionize your organization's data analytics efforts. Understanding Power BI Project Reports: A Power BI project report is a comprehensive and interactive visual representation of data collected from various sources within an organization. It combines data modeling, visualization, and storytelling to present information in a compelling and easily digestible format. With its intuitive drag-and-drop interface and rich visualization capabilities, Power BI enables users to create stunning reports that provide deep insights int...

Power BI Python integration

Image
Power BI is a business analytics service by Microsoft that provides interactive visualizations and business intelligence capabilities with an interface simple enough for end-users to create their own reports and dashboards. Python is a powerful programming language with a wide range of libraries and tools that enable data analysis, machine learning, and visualization. Power BI Python integration allows users to leverage Python's data science capabilities within Power BI. In this blog, we will explore Power BI Python integration, its benefits, and how to use it to create dynamic reports and visualizations. Benefits of Power BI Python integration: Extensive libraries and tools: Python has a wide range of libraries and tools that make data analysis, machine learning, and visualization much easier. With Power BI Python integration , users can leverage these tools to create more robust and dynamic reports. Flexibility: Python allows users to customize their data analy...

Jira Power Bi Dashboard | Stratada | Microsoft Data Strategy

Image
 Jira Power Bi Dashboard Jira is a popular project management tool used by many organizations to track tasks, issues, and projects. One of the key benefits of using Jira is the ability to gather data and insights into your team's performance and productivity. However, with so much data to sift through, it can be challenging to analyze and make sense of it all. This is where Power BI comes in. Power BI is a business analytics service by Microsoft that provides interactive visualizations and business intelligence capabilities with an interface simple enough for end-users to create their reports and dashboards. With Power BI, you can create a comprehensive dashboard that displays key metrics and insights from Jira in real-time. In this blog, we will explore how to create a Jira Power BI dashboard. Getting started with Jira Power BI Dashboard To create a Jira Power BI dashboard, you will need to connect your Jira instance to Power BI. You can do this by using the Jira content pack fo...

Introduction to Power BI and Jira - Stratada

Image
 Introduction to Power BI and Jira Power BI is a business analytics tool provided by Microsoft that allows users to connect, analyze, and visualize data from various sources. Jira, on the other hand, is a project management tool commonly used by software development teams to track issues and bugs, manage agile projects, and plan sprints. Integrating Jira with Power BI can help teams gain better insights into their project data, track progress, and make data-driven decisions. In this guide, we will explore the steps to connect Jira with Power BI and create reports and dashboards. Step 1: Connecting Jira with Power BI To connect Jira with Power BI, follow these steps: Open Power BI and click on "Get Data" from the Home tab. Search for "Jira" in the search bar and select "Jira (beta)" from the list of available connectors. Enter the Jira URL, username, and password to connect to your Jira account. Select the project and issues you want to analyze. Click ...

How To Make A Pareto Chart In Power BI | Stratada

Image
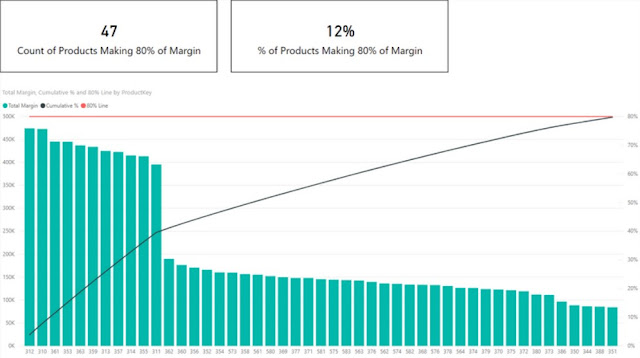
 How To Make A Pareto Chart In Power BI How To Make A Pareto Chart In Power BI | Stratada " Pareto Chart " or "Pareto Analysis" was introduced by a famous economist "Vilfredo Pareto". Pareto chart is a bar chart for ranking aspects of the problem. Typically only a few aspects make up a significant portion of the problem while many trivial aspects exist. Training on Stratada in Washington by Advance Innovation Group, helps you understand one of the most useful 7 QC tools called Pareto. It is based on Pareto principals which are also known as 80/20 principal. According to that principle, 20% of our problems lead to other 80% of the problem or defects so rather than concentrating on 80% of our problems. Or if we talk about economy 80% of the wealth in the hands of about 20% of the people. Similarly, a large percentage of errors or defects in any process is usually due to few problems. Pareto principle helps you to identify those significant vital problems so ...

How to Make The Most of Your Microsoft Project Training

Image
  Did you know that you can use project management principles in almost anything you do in your daily life? No? Well, the truth is that project management principles are so widely acceptable, that they can be attributed to almost anything. When it comes to managing projects big or small, the Microsoft Project Server program is a tool that is the best you can avail. Not only is Microsoft good at making operating systems, but it is also great at coming up with project management tools which are easy to use and make the maximum use of your resources. So if you have a business that has multiple projects going on simultaneously, the Microsoft EPM is your best bet. And if you want to make a career out of being a professional in this field, do look through the information below. Are you someone who has had Microsoft Project training before? Or is it that you are a complete novice? You will have to determine beforehand what level you are at as far as knowledge about this tool is concerned...

Using Power BI to Extend and Streamline Project Online Analytics

Image
We recently recorded our first webcast on using several key features in Microsoft Power BI to extend and streamline your project analytics (or business analytics, in general).  While there are numerous features of Power BI that enable you to perform more advanced analytics, and new-and-improved features are released on a monthly basis, we decided to focus on three unique features: buttons , bookmarks , and drillthrough .  We would be remiss not to leverage these in the reports that we develop for clients.  They are powerful, dynamic, and impactful.  They enable end-users to navigate reports with ease, switch between measures, perform drilldowns on multiple visuals at the same time, mine the data for deeper insights, etc.  You get to use your imagination. Data from line-of-business applications, such as Microsoft Project Online, can be challenging to explore, uncover hidden stress points, and derive actionable insights.  Power BI can immensely simplify...